Demand
Inventory ABC–XYZ Calculator: classify your SKUs
The ABC-XYZ Inventory Calculator is a free web tool that helps you classify your portfolio using two key criteria: each product’s business importance and the variability of its demand. Its purpose is to help you prioritise SKUs, set differentiated policies and understand which items need tighter control, review or deeper analysis within your planning process.
To get started, upload a CSV file with your historical product data. At a minimum, it should include a product code or SKU, a value linked to each item and enough data to measure demand variability. That value can be sales, consumption, revenue or margin depending on the lens you want to use to assess each product’s importance.
Once the file is uploaded, the tool calculates the ABC classification. This shows each product’s share of the total portfolio value. By default, A items typically account for roughly 80% of cumulative value, B items take it up to 95% and C items make up the remainder. These thresholds can be adjusted to better match your business reality.
Next, the tool calculates the XYZ classification. This dimension reflects demand variability or forecasting difficulty. X items are more stable and easier to predict, Y items have medium variability and Z items are more volatile or harder to anticipate. While the tool includes standard parameters, you can change them if you know your demand behaviour well.
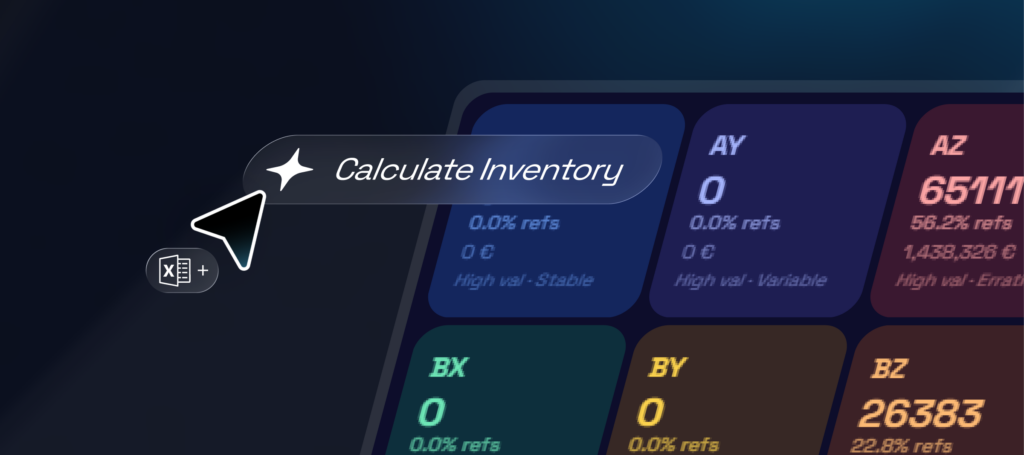
When you run the calculation, you’ll get an ABC–XYZ matrix that combines both dimensions. This matrix makes it easy to spot which products are critical and stable, which are important but hard to forecast and which have low impact but high variability. If you select a matrix cell, the product table filters automatically so you can analyse that specific group.
Alongside the matrix, the tool provides several visualisations to help interpret the results. Bar and donut charts show how many SKUs sit in each category and the share of cumulative value they represent. A scatter chart plots each product by importance and variability, making it easier to spot edge cases or items that need a closer review.
Finally, you can use the detailed table to review each SKU individually. This output can then be used to set differentiated inventory, procurement and forecast review policies, as well as to tighten operational control where it matters.
As a result, you’ll get a clear segmentation of your portfolio. This classification helps you prioritise the most strategic products, manage the most volatile demand items more effectively and make smarter decisions on stock, purchasing and planning.